To debug a program, it must be compiled with debug information. Compiling a program with
debug information allows to:
- Execute the program line by line.
- Run the program till a certain point (a breakpoint)
- Inspect the contents of variables or memory locations while the program is running.
Breakpoints will cause a running program to stop when the execution reaches
the line where the breakpoint was set. At that moment, control is returned to the IDE, and it is
possible to continue execution.
To set a breakpoint on the current source line, use the ”Debug--Breakpoint” menu entry, or
press CTRL-F8.
A list of current breakpoints can be obtained through the ”Debug--Breakpoint list” menu.
The breakpoint list window is shown in figure (6.11).
In the breakpoint list window, the following things can be done:
-
New
- Shows the breakpoint property dialog where the properties for a new breakpoint can
be entered.
-
Edit
- Shows the breakpoint property dialog where the properties of the highlighted
breakpoint can be changed.
-
Delete
- Deletes the highlighted breakpoint.
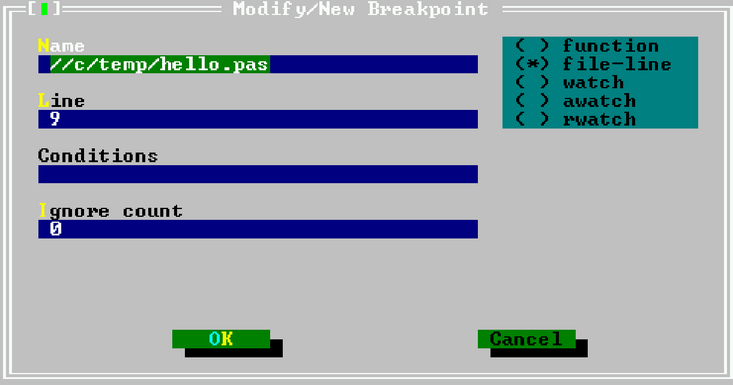
The dialog can be closed with the ’Close’ button. The breakpoint properties dialog is shown in
figure (6.12)
The following properties can be set:
-
type
-
-
function
- function breakpoint. The program will stop when the function with the given
name is reached.
-
file-line
- Source line breakpoint. The program will stop when the source file with given
name and line is reached;
-
watch
- Expression breakpoint. An expression may be entered, and the program will
stop as soon as the expression changes.
-
awatch
- (access watch) Expression breakpoint. An expression that references a memory
location may be entered, and the program will stop as soon as the memory
indicated by the expression is accessed.
-
rwatch
- (read watch) Expression breakpoint. An expression that references a memory
location may be entered, and the program will stop as soon as the memory
indicated by the expression is read.
-
name
- Name of the function or file where to stop.
-
line
- Line number in the file where to stop. Only for breakpoints of type file-line.
-
Conditions
- Here an expression can be entered which must evaluate True for the program to
stop at the breakpoint. The expressions that can be entered must be valid GDB
expressions.
-
Ignore count
- The number of times the breakpoint will be ignored before the program
stops;
Remark:
- Because the IDE uses GDB to do its debugging, it is necessary to enter all expressions
in uppercase on FREEBSD.
- Expressions that reference memory locations should be no longer than 16 bytes on
LINUX or go32v2 on an Intel processor, since the Intel processor’s debug registers are
used to monitor these locations.
- Memory location watches will not function on Win32 unless a special patch is applied.
When debugging information is compiled in the program, watches can be used.
Watches are expressions which can be evaluated by the IDE and shown in a separate window.
When program execution stops (e.g. at a breakpoint) all watches will be evaluated and their
current values will be shown.
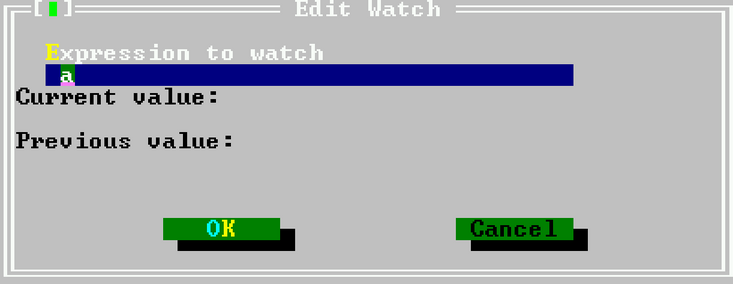
Setting a new watch can be done with the ”Debug--Add watch” menu command or by pressing
CTRL-F7. When this is done, the watch property dialog appears, and a new expression can be
entered. The watch property dialog is shown in figure (6.13).
In the dialog, the expression can be entered, any possible previous value and current value are
shown.
Remark: Because the IDE uses GDB to do it’s debugging, it is necessary to enter all expressions in
uppercase in FREEBSD.
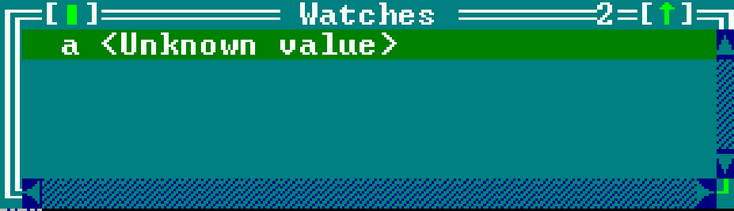
A list of watches and their present value is available in the watches window, which can be
opened with the ”Debug--Watches” menu. The watch list window is shown in figure
(6.11).
Pressing ENTER or the space bar will show the watch property dialog for the currently highlighted
watch in the watches window.
The list of watches is updated whenever the IDE resumes control when debugging a
program.
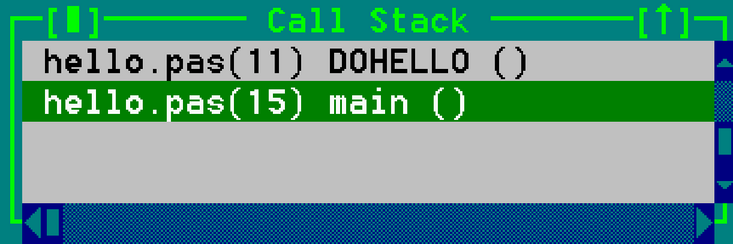
The call stack helps in showing the program flow. It shows the list of procedures
that are being called at this moment, in reverse order. The call stack window can be shown using
the ”Debug--Call Stack” It will show the address or procedure name of all currently active
procedures with their filename and addresses. If parameters were passed they will be shown as well.
The call stack is shown in figure (6.15).
By pressing the space bar in the call stack window, the line corresponding to the call will be
highlighted in the edit window.
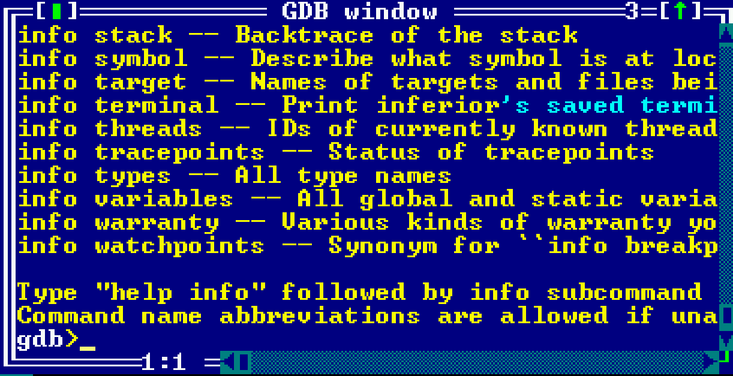
The GDB window provides direct interaction with the GDB debugger. In it,
GDB commands can be typed as they would be typed in GDB. The response of GDB will be
shown in the window.
Some more information on using GDB can be found in section 10.2,
page 349, but the final reference is of course the GDB manual itself
3. The
GDB window is shown in figure (6.16).