Scientific Visualization and Animation: Examples from Geography
|
Prof. David Bernstein
James Madison University
|
|
Computer Science Department
|
bernstdh@jmu.edu
|
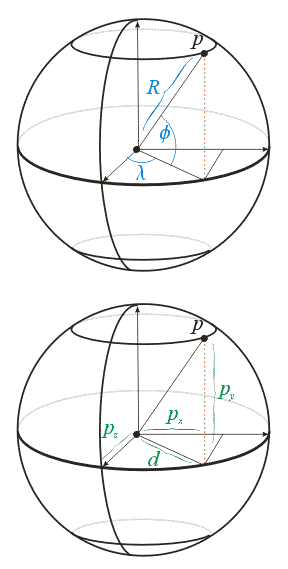
From Longitude/Latitude to Cartesian Coordinates
Notation
From Longitude/Latitude to Cartesian Coordinates (cont.)
- Derivation of the Conversion:
- \(\cos \phi = d / R \Rightarrow d = R \cos \phi\)
- \(\cos \lambda = p_{z}/d \Rightarrow p_{z} = d \cos \lambda
= R\cos \phi \cos \lambda\)
- \(\sin \lambda = p_{x}/d \Rightarrow p_{x} = d \sin \lambda
= R \cos \phi \sin \lambda\)
- \(p_{y} = R \sin \phi\)
- Note:
- This is very similar to the conversion of spherical coordinates
to Cartesian coordinates (but it uses the latitude
not the colatitude)
From Longitude/Latitude to Cartesian Coordinates (cont.)
svaexamples/cartography/projections.c
(Fragment: lonlat2xyz)
Visualizing a Globe
- What We Need To Do:
- Represent geographic features
- Read country boundaries from a file
- Create longitude/latitude lines
- Draw geographic features
- 3D Visualization:
- We will use an orthographic visualization (i.e., we
will essentially ignore \(z\) coordinates)
Visualizing a Globe (cont.)
Representing Geographic Features
svaexamples/cartography/feature.c
Visualizing a Globe (cont.)
- File Format:
- One record description of each file (number of polygons,
number of countries)
- One record description of each polygon (polygon number,
country number,number of vertices,country name)
- Each polygon has one record for each vertex
(longitude, latitude)
- An Important Observation:
- Each country might consist of several polygons
Visualizing a Globe (cont.)
Reading Country Borders
svaexamples/cartography/initialization.c
(Fragment: readPolygons)
Visualizing a Globe (cont.)
Longitude/Latitude Lines
svaexamples/cartography/initialization.c
(Fragment: createGrid)
Visualizing a Globe (cont.)
Drawing the Features
svaexamples/cartography/globe.c
(Fragment: display)
Visualizing a Globe (cont.)
Putting It All Together
svaexamples/cartography/globe.c
(Fragment: main)
Classical Map Projections
- Objective:
- Project points on the surface of the
Earth onto a map
- Some Intuition:
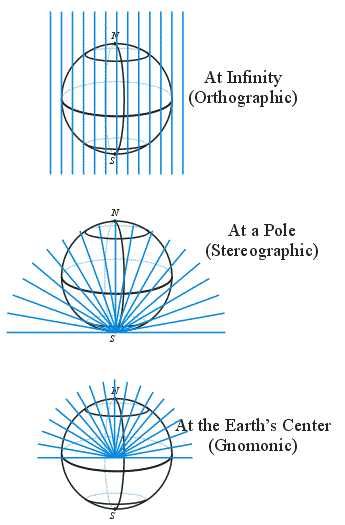
- Shine a light onto or through a transparent Earth
` and capture the shadows cast by the opaque features
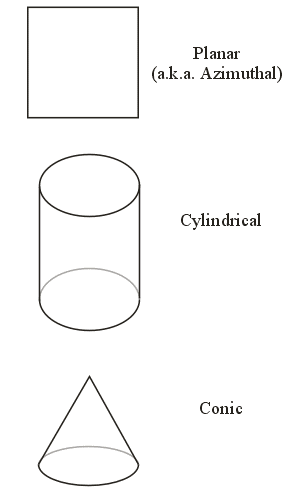
- The parameters are: the shape of the screen
(called the projection surface), the position of the
projection surface, and the location of the light source
Classical Map Projectins (cont.)
Projection Surfaces
Classical Map Projectins (cont.)
Light Sources
Desirable Properties of Map Projections
- The Most Common:
- Conformal (i.e., angles are preserved)
- Equal Area (i.e., areas are in constant proportion)
- Equidistant (i.e., distances are in constant proportion)
- An Important Mathematical Result:
- A single projection can not be both conformal
and equal area
Equatorial Cylindrical Equal Area Projection
- Parameters:
- \(\lambda_{0}\) is the standard longitude
(i.e., the horizontal center of the projection)
- Projection:
- \(x = R (\lambda - \lambda_{0}) \)
- \(y = R \sin(\phi)\)
- Inverse:
- \(\lambda = \lambda_{0} + \frac{x}{R}\)
- \(\phi = \sin^{-1}(y / R)\)
Equatorial Cylindrical Equal Area Projection (cont.)
The World
Equatorial Cylindrical Equal Area Projection (cont.)
svaexamples/cartography/projections.c
(Fragment: cylindricalEqualArea)
Visualizing a Map
- What We Need To Do:
- Everything for visualizing a globe
- Perform the projection
- An Important Observation:
- Some projections will "tear" polygons
Visualizing a Map (cont.)
Drawing the Features
svaexamples/cartography/map.c
(Fragment: display)
There's Always More to Learn